The Power of Red, Amber, Green
Transform your production meetings with the powerful Red, Amber, Green system. Learn how this simple visual method helps you instantly spot problems, focus discussions, and solve issues faster.
Picture the daily production meeting. It’s probably first thing in the morning, everyone’s clutching a mug of tea or coffee, and someone is running through a stack of reports from the previous shift. You’re wading through spreadsheets, deciphering handwritten notes, and trying to piece together a coherent story of what actually happened on the shop floor. It’s a necessary ritual, we tell ourselves, but it can also feel like a slow, painful archaeological dig for the one or two critical issues that actually need your attention right now.
What if you could walk into that room and, in under five seconds, know exactly where the fires are? What if, before anyone even says a word, the entire team’s focus was already locked onto the most urgent problems? This isn’t some futuristic fantasy. It’s the incredibly simple, and frankly, revolutionary power of a Red, Amber, Green status system.
This concept, often called RAG, is nothing more than using colour coding to signal the health of a process, a machine, or a production line. It's a visual language that everyone understands instantly. In this post, we’re going to explore why this simple visual trick works so well, how it can completely change the dynamic of your production meetings, and a few practical ways you can start using it tomorrow. Trust me, it’s one of the most effective, low-cost changes you can make.
The Brain Science Bit: Why This Isn't Just Making Things Look Pretty
You might be thinking, “Colours? Really? We’re running a complex manufacturing operation here.” And I get it. It sounds almost too simple to be effective. But the power of RAG isn't in its complexity; it's in its direct line to how our brains are wired.
Think about it. For thousands of years, our brains evolved to react instantly to certain visual cues. Red means danger, blood, stop. It grabs our attention and screams “look at me now!” Green signifies safety, growth, go. It’s calming and reassuring. Amber, or yellow, sits in the middle. It’s the colour of caution, of transition, of “pay attention, something is changing.” A traffic light doesn’t need a manual. You just get it.
This is basic psychology at play. Our brains process images and colours about 60,000 times faster than text. When you see a spreadsheet filled with numbers, your brain has to perform a series of tasks. It has to read the number, understand its context (is 92% OEE good or bad for this machine?), compare it to a target, and then make a judgement. This all takes cognitive energy.
Now, imagine a big screen on the wall. It shows a list of your production lines. Line 3 is a big, angry red block. Your brain doesn’t need to do any of that work. It skips right to the conclusion: Line 3 has a serious problem. The conversation can start immediately. “Okay team, what’s happening on Line 3?”
I once worked with a production manager who was incredibly proud of his detailed, multi-tabbed Excel reports. He’d spend an hour every morning compiling them. The trouble was, by the time he presented them in the meeting, the information was already out of date, and nobody had the time or energy to properly digest it. The truly urgent issues were buried in a sea of data. We eventually convinced him to try a simple RAG board. The first day, a critical machine went red. The maintenance lead saw it, grabbed his tools, and was working on it before the official meeting had even started. The manager was converted on the spot. It's not about replacing data; it's about making that data instantly actionable.
Turning Shop Floor Chaos into Focused Conversation
So, we know the psychology is sound. But how does this translate to the beautiful, organised chaos of a UK manufacturing floor? Typical production meetings often suffer from a few common problems. They can be too long, they can get sidetracked by issues that aren’t urgent, and sometimes the loudest voice in the room dictates the agenda, not the biggest problem.
A RAG system cuts through all of that noise. It democratises the data. It doesn't care about opinions or who shouts the loudest; it just reflects reality in a way no one can ignore. When you walk into a meeting and see a visual dashboard, the agenda sets itself.
-
Red Items: These are your non-negotiables. The meeting starts here. A machine is down. A quality check has failed catastrophically. A key supplier delivery is late. These are the issues actively costing you money and threatening your schedule. The discussion is immediately focused: What is the problem? Who owns it? What is the plan to fix it? When will we have an update?
-
Amber Items: These are your next priority. A machine is running slow. Raw material stock is getting low. A team is slightly behind schedule. These are your early warnings. They are the problems that will turn red tomorrow if you ignore them today. This is where you get proactive. The RAG system allows you to tackle issues upstream, preventing major fires by dealing with the smoke.
-
Green Items: This is just as important. A sea of green is a powerful thing. It tells you what’s working well. You can give credit where it’s due, acknowledge the team’s hard work, and learn from what’s going right. In the meeting, you can largely skim past the green items. A quick, “Looks like Line 1 and 2 are running perfectly, great work team,” is often all you need. This alone can cut meeting times in half.
This visual clarity transforms the entire dynamic. The meeting becomes less about reporting the past and more about solving problems for the future. It forces a sense of urgency and accountability. You can't hide from a big red box with your name next to it. It’s not about blame; it’s about clarity.
Setting Up Your Central Command Centre
Alright, you’re sold on the idea. How do you actually make this happen? The good news is, you can start simple. The most important principle is to have a single, centralised display that is visible to everyone. It needs to become the focal point of your production huddle.
You have two main options here: physical or digital.
A physical board is the easiest way to start. A large whiteboard with magnetic, coloured cards or even just coloured markers works perfectly. You can divide it into sections for each machine, line, or process. It’s tactile, it’s simple, and it has zero IT overhead. The downside is that it requires someone to physically update it, which means the data is only as fresh as the last time someone walked over to it.
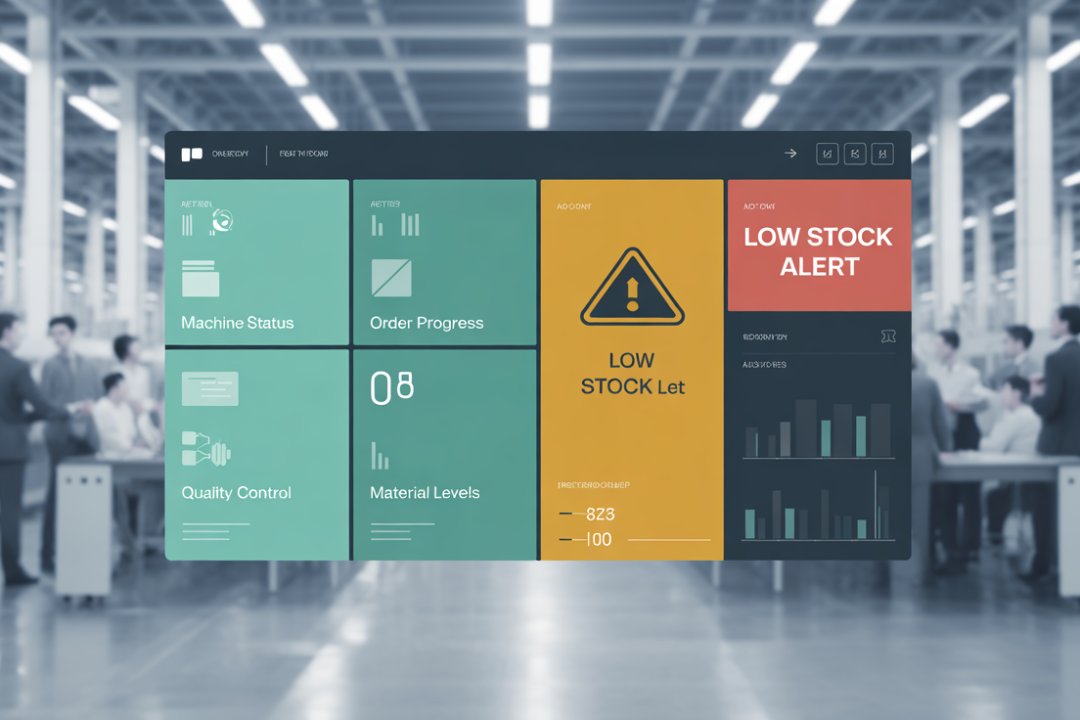
A digital display, like a large TV screen on the factory wall, is the next level up. This is where things get really powerful. When connected to your machine sensors and production systems, the status can be updated in real time. A machine stops, its status flips to red automatically. An order is completed, it turns green. This provides a live, breathing view of your entire operation.
Whichever you choose, the next step is to decide what data to colour code. Don’t try to track everything. Start with the vital signs of your factory. Good candidates include:
-
Machine Status: Is it running (Green), running slow or with minor faults (Amber), or stopped (Red)?
-
Order Progress: Is the job on schedule (Green), at risk of delay (Amber), or already late (Red)?
-
Quality Control: Are pass rates within tolerance (Green), nearing the limit (Amber), or failing (Red)?
-
Material Levels: Are stocks healthy (Green), need reordering soon (Amber), or critically low (Red)?
The key here is consistency. Everyone in the organisation needs to agree on what each colour means for each metric. Red for Machine A must mean the same thing as Red for Machine B. Write these definitions down. Make them clear, simple, and based on objective data (e.g., “Amber = OEE is between 75% and 85%. Red = OEE is below 75%.”). Confusion is the enemy of a good visual system.
How to Actually Get Started This Week
Rolling out a new system, even a simple one, can feel daunting. The secret is to not try and do everything at once. You don’t need a massive project plan or a huge budget. You can start small and prove the concept.
Here’s a simple, four-step way to pilot a RAG system:
-
Pick One Area. Choose a single production line, a specific work cell, or even just one problematic machine. This will be your testing ground. It lowers the risk and makes it easier to manage.
-
Define Your Rules with the Team. Get the operators and team leaders from that area in a room. Ask them: “What are the most important things we need to know about this line at a glance?” Work with them to define the Red, Amber, and Green triggers. Getting their buy-in from the start is absolutely critical. This shouldn't feel like something being done to them, but with them.
-
Set Up Your Board Grab that whiteboard or set up a simple spreadsheet on a screen. For the first week, get the team to update it manually at set intervals, maybe every hour. This helps embed the habit and the thinking process.
-
Run Your Meetings Differently. At your next daily huddle, stand in front of the board. Start with the reds. Then the ambers. Acknowledge the greens. Watch what happens. The conversation will almost certainly be more focused and productive. After a week or two, ask the team for feedback. What’s working? What’s confusing? What should we change?
This iterative approach allows you to build a system that genuinely works for your specific environment. You learn as you go, and the team feels a sense of ownership, which makes them far more likely to embrace it and keep it going.
The Simple Truth of Seeing is Believing
Look, running a manufacturing plant is complex. You’re juggling supply chains, machine maintenance, quality standards, and customer deadlines. In the face of all that complexity, it’s easy to believe that the solutions must also be complex. We get drawn to sophisticated software and convoluted processes, hoping they hold the magic answer.
But sometimes, the most powerful changes are the simplest ones. The RAG system is a perfect example. It’s not about adding more data; it’s about adding clarity. It strips away the noise and focuses your team’s collective brainpower on what truly matters at that exact moment. It shortens meetings, accelerates problem solving, empowers your team, and can even improve morale by making progress visible and celebrating successes.
Starting with a simple whiteboard is a fantastic first step. As you see the benefits and want to take it further, automating the data collection and display is the logical next move. This is exactly why we developed tools like our FactoryIQ EdgeEssentials. It connects directly to your assets on the shop floor, pulls the data automatically, and displays it in a clear, real-time RAG dashboard that everyone can see. It takes the human effort out of updating the board and gives you a truly live picture of your operations.
So, take a look at your next production meeting. If it feels like you’re searching for a needle in a haystack, maybe it’s time to stop searching and just get a giant, colour-coded magnet. Give RAG a try. You might be shocked at the difference three simple colours can make.
By implementing this system, you’re not just improving your meetings — you’re creating a culture of clarity, focus, and action. And that’s a change that can ripple through your entire organisation, driving efficiency, collaboration, and a shared sense of purpose. It’s a small step that can lead to big results, and it’s one you can start today. The impact of such a straightforward system can be profound, transforming not just how you conduct meetings, but how your entire team approaches problem-solving and decision-making on a daily basis.